

『Flow Rate through Venturi Meter Proving: Calculating Discharging Coefficients in Laboratory Systems』Related information(clamp on meter|electromagnetic meter|venturi meterrotameter|orifice meter|ultrasonic flow meter|mass flow meter|coriolis mass flow meter|coriolis flow meter|magnetic flow meter|magmeter flow meter|magflow flow meter|mag meter flow meter|electromagnetic flow meter|vortex flow meter|turbine flow meter|thermal mass flow meter|thermal flow meter|rotameter flow meter)

Quick Answer
Venturi meter flow rate in a laboratory proving system comes from differential pressure, fluid density, throat area, and the discharge coefficient Cd. For a machined venturi tube with a beta ratio from 0.4 to 0.6, the Cd value in a clean lab setup often sits between 0.95 and 0.99. Send us your pressure in bar, temperature in °C, pipe size in DN, and flow range to get a venturi meter recommendation or a reference flow meter quote.
Flow Rate through Venturi Meter Proving: Calculating Discharging Coefficients in Laboratory Systems
Laboratory proving of a venturi meter is a direct job. The details decide whether your Cd value is reliable or not. A venturi meter works on the Bernoulli principle. The pressure drops at the throat. The flow rate Q is calculated from that differential pressure. The formula uses Cd, throat area A2, fluid density rho, and the beta ratio. That beta ratio is throat diameter divided by pipe diameter.
Most engineers skip this part. They trust the theoretical Cd value of 0.995. In a real laboratory system, the Cd value changes with Reynolds number, pressure tap location, surface roughness, and upstream pipe configuration. We have seen this pattern on customer sites many times. A well machined venturi in a DN100 line can show a Cd of 0.982. The same venturi installed after a single elbow with short straight run can drop to 0.955.
Discharge Coefficient Basics for Laboratory Venturi Meters
Here is the thing. The discharge coefficient Cd is the ratio of the actual flow rate to the ideal flow rate. In a laboratory system, the ideal flow rate assumes no friction loss and a uniform velocity profile. The real flow has friction and a velocity profile that is not flat. Cd corrects that difference. For a machined venturi tube, the Cd is normally between 0.95 and 0.995. A fabricated sheet metal venturi can show a Cd from 0.85 to 0.95. That difference matters when you report flow rate uncertainty.
The Reynolds number at the pipe has a strong effect. For DN50 to DN200 water lines, the Reynolds number often ranges from 80,000 to 600,000. In that range, the Cd curve is fairly flat. Below 80,000, the Cd value drops. This is why a laboratory proving run should cover the same Reynolds number range as the field installation. Because a discharge coefficient measured at 20,000 cannot be used safely at 200,000.
Pressure tap location also matters. The upstream tap is usually placed one pipe diameter before the inlet cone. The throat tap sits at the throat. If the throat tap has a burr or is not flush, the measured differential pressure will be wrong. We have seen a paint manufacturer in Southeast Asia lose 2 percent of indicated flow because a pressure tap was not deburred. That single defect caused the Cd to shift from 0.98 to 0.94.
Typical Venturi Proving Setup for Flow Rate and Cd
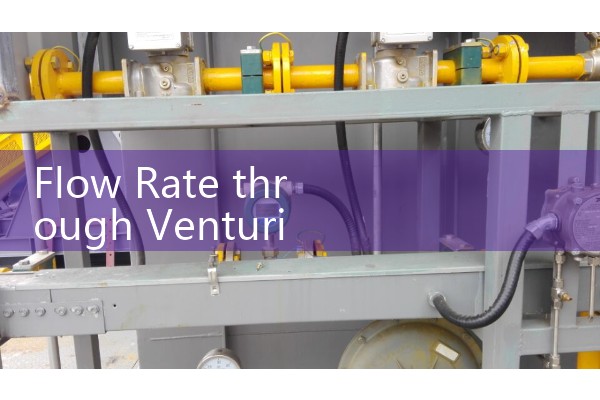
A basic laboratory proving system consists of a pump, a flow control valve, a straight run, the venturi meter, a differential pressure transmitter, a temperature sensor, and a reference flow meter. For water at 25 °C, the density is about 997 kg per cubic meter. The viscosity is about 0.89 centipoise. You also need an absolute pressure transmitter or a gauge pressure transmitter for density compensation if the liquid is not pure water.
In one lab in Vietnam, the setup used a DN80 venturi tube with a
The reference meter is the key. For conductive liquids above 5 µS/cm, a magnetic flow meter is a good reference meter. A Coriolis mass flow meter reports kg/h directly and works well for liquids with changing density or viscosity. An ultrasonic flow meter with a clamp on design is useful when you cannot break the line. For hazardous area proving, specify ATEX Zone 1 or Zone 2 for the dp transmitter and reference meter. Silver Automation Instruments supplies all three meter types. We also supply PT100 temperature sensors and pressure transmitters for density correction.
How to Request a Venturi Flow Meter Quote
Tell us the fluid type, the minimum and maximum flow rate, the pipe size, the pressure, and the temperature. For gas service, also include the molecular weight or gas composition. Send us your pressure in bar, temperature in °C, pipe size in DN, and flow range. We will reply with a venturi meter recommendation or a reference flow meter quote. If you need a full laboratory proving skid, describe the piping layout and the required uncertainty.
Contact Silver Automation Instruments. Tel: +86-25-68650347. Whatsapp: +86-25-52155837. WeChat: +86 15365082610. Our website is flow-meter.com.au.
FAQ: Venturi Meter Flow Rate and Discharge Coefficient
What is a discharge coefficient for a venturi meter?
The discharge coefficient Cd is the ratio of actual flow rate to ideal flow rate. It corrects for friction losses and velocity profile effects. For a machined venturi tube, Cd is usually between 0.95 and 0.995.
How do you calculate flow rate through a venturi meter in a laboratory?
You measure differential pressure, fluid density, throat diameter, and pipe diameter. Then you apply the venturi flow equation with the Cd value. The equation is Q equals Cd times A2 times the square root of 2 times delta P divided by rho times 1 minus beta to the fourth power.
What Cd value should you expect for a machined venturi in water service?
In a clean laboratory setup with proper straight run, the Cd value is often 0.96 to 0.99 at Reynolds numbers above 80,000. A value below 0.90 usually indicates a problem with installation or pressure taps.
Which reference meter should you use for venturi proving?
For water and wastewater, use a magnetic flow meter with 0.2 percent accuracy. For liquids with changing density, use a Coriolis mass flow meter. For non intrusive checks, use a clamp on ultrasonic flow meter. Silver Automation Instruments supplies all three types.
How can Silver Automation Instruments help with a venturi proving system?
We supply reference flow meters, differential pressure transmitters, temperature sensors, paperless recorders, and pressure transmitters. Send us your fluid type, flow range, pipe size, pressure, and temperature. We will recommend a proven setup for your laboratory.
 Hot Blog
 Related AD